
Modeling the Effects of Accumulative Photosynthesis on Flowering Time Across Diverse Environments
Authors: Earl Ranario
Photosynthesis provides the energy and carbon for plant growth and reproduction, making it a key factor in the timing of developmental transitions like flowering. We model the relationship between accumulated photosynthesis and flowering time using the Farquhar, von Caemmerer, and Berry (FvCB) model, and compare this approach against a Growing Degree-Days (GDD) baseline — demonstrating that the photosynthesis model generalizes better across diverse environments.
Introduction
Environmental conditions — light intensity, atmospheric CO₂, and temperature — strongly modulate photosynthetic activity and indirectly affect when a plant initiates flowering. High sugar availability from photosynthesis has been shown to accelerate developmental transitions, leading to earlier flowering. We parameterize the FvCB model using cowpea MAGIC line data from Davis, CA, and validate on a geographically distinct site (Kearney, CA).
Data
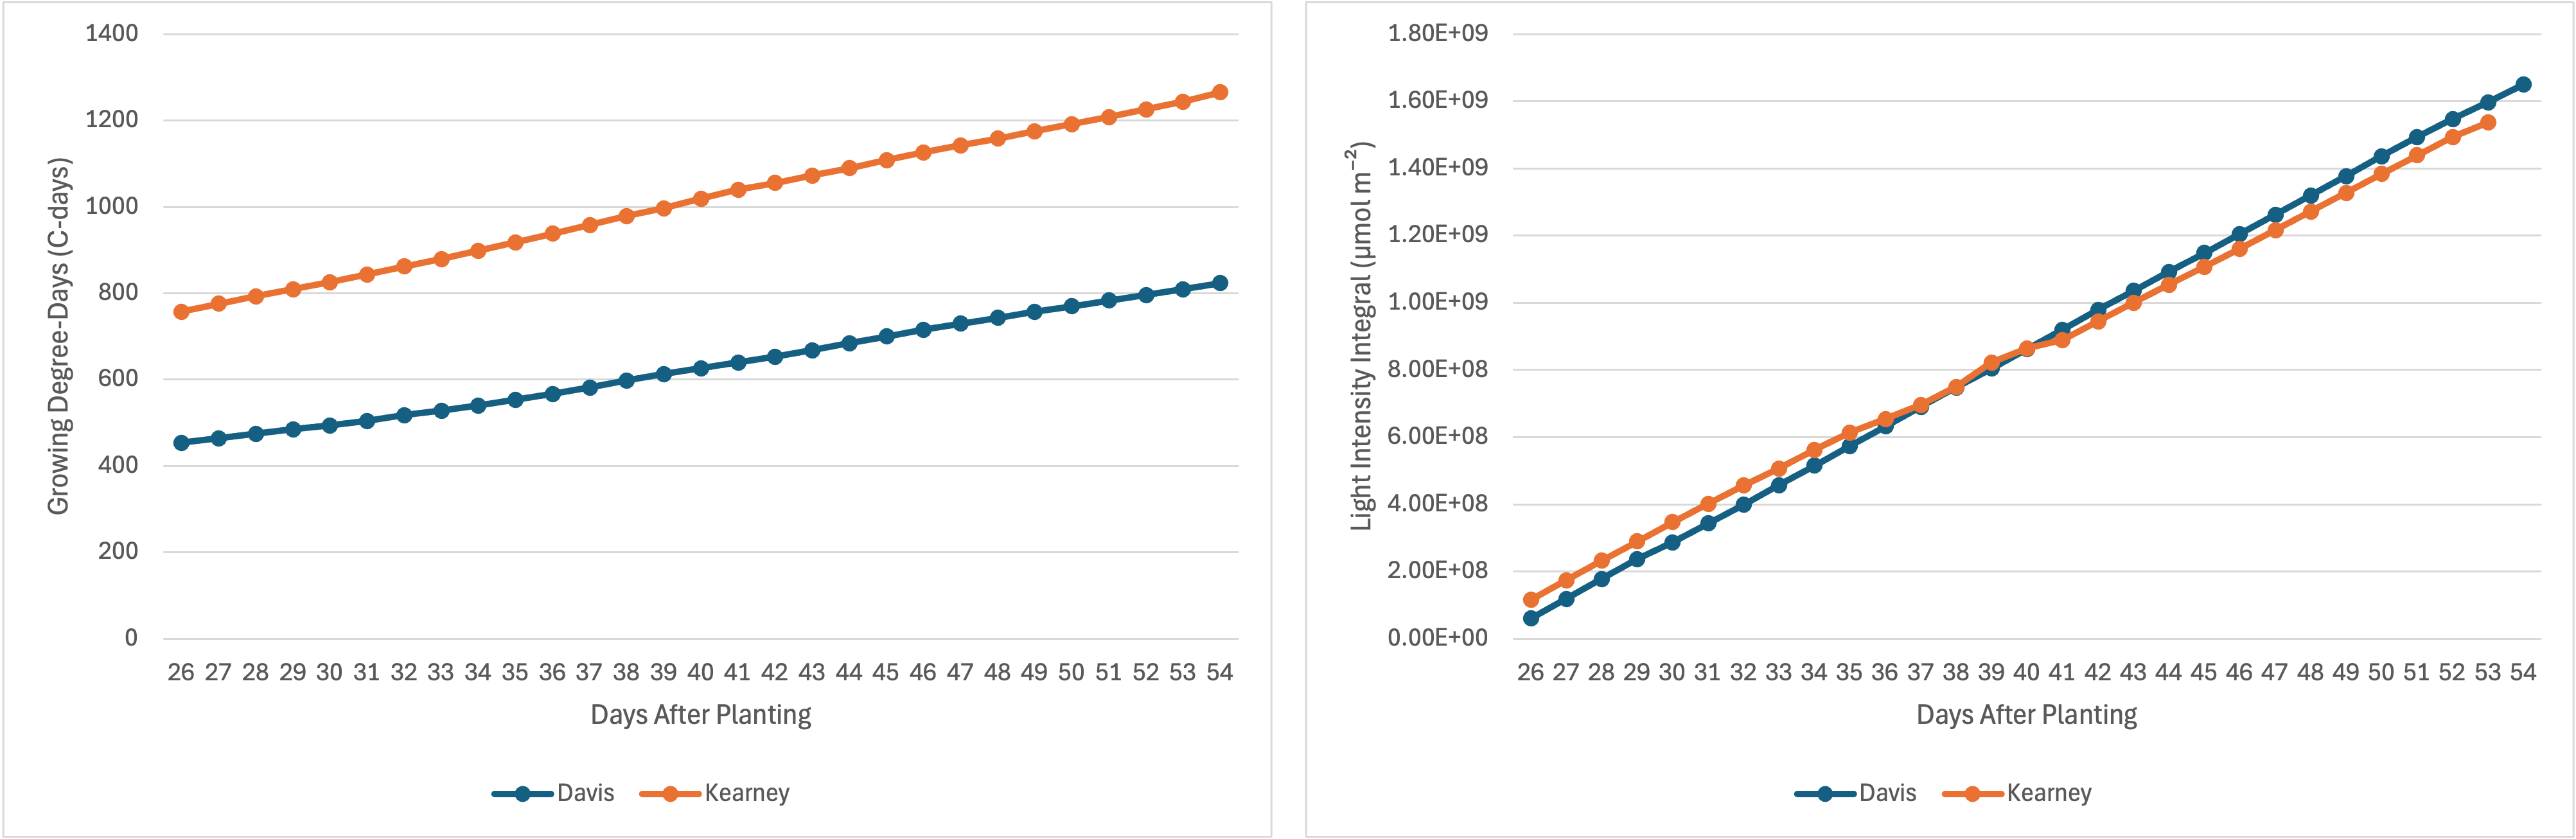 Figure 1: Growing Degree-Days (left) and light intensity integral (right) for each day since planting at Davis and Kearney locations.
Environmental inputs (average temperature and PPFD) were collected from CIMIS at two locations across three 14-day intervals. FvCB parameters (V_cmax, J_max, TPU, and their activation energies) were fitted per genotype using PhoTorch.
Method
Growing Degree-Days Baseline:
\[\text{FT} = s \sum_{i=1}^{n} (T_a - T_b)\Delta t\]Cumulative Photosynthesis Model using the FvCB net photosynthesis rate A:
\[P = \sum_{i=1}^{n} A_i \, \Delta t \qquad \text{then} \qquad \text{FT} = sP + b\]where A is computed from Rubisco-limited (W_c), RuBP-limited (W_j), and phosphate-limited (W_p) carboxylation rates, accounting for temperature responses via the Arrhenius function.
Model Fit
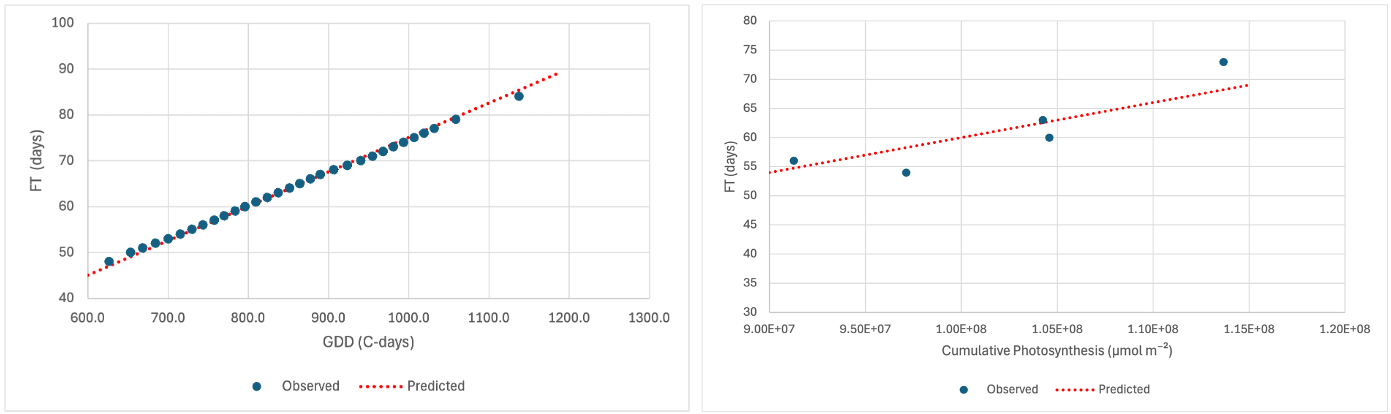 Figure 2: Flowering time vs. Growing Degree-Days (left) and vs. Cumulative Photosynthesis (right) — red line is predicted, blue points are observed — fitted on Davis data.
| Model | b | s | R² | RMSE |
|---|---|---|---|---|
| GDD | — | 0.0751 | 0.999 | 0.007 |
| Cumulative Photosynthesis | 0.002 | 5.99×10⁻⁷ | 0.773 | 3.183 |
The GDD model fits the Davis training data near-perfectly (R²=0.999) but is tightly coupled to the local temperature regime. The photosynthesis model achieves a moderate fit (R²=0.773) while encoding richer environmental signal.
Validation
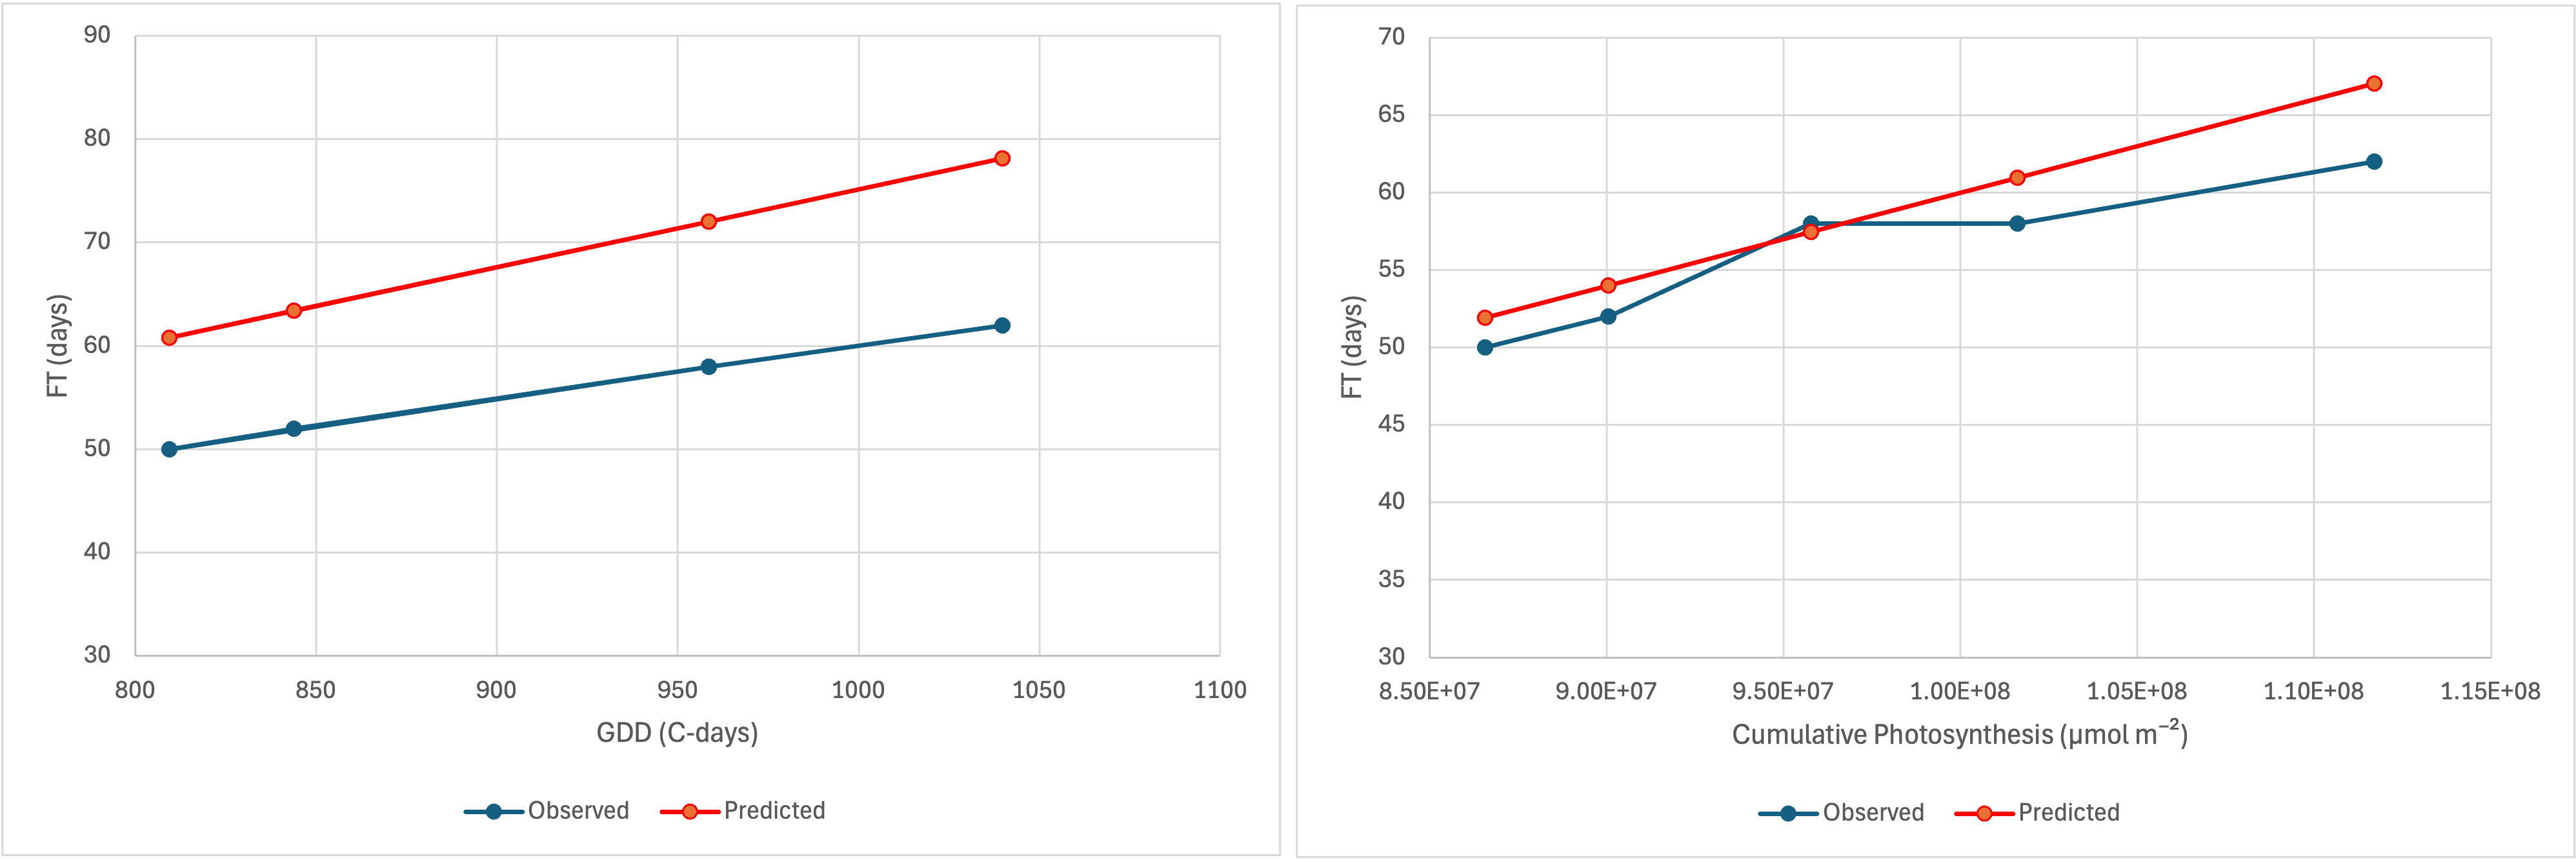 Figure 3: Validation of both models on Kearney data — red line/points are predicted, blue points are observed.
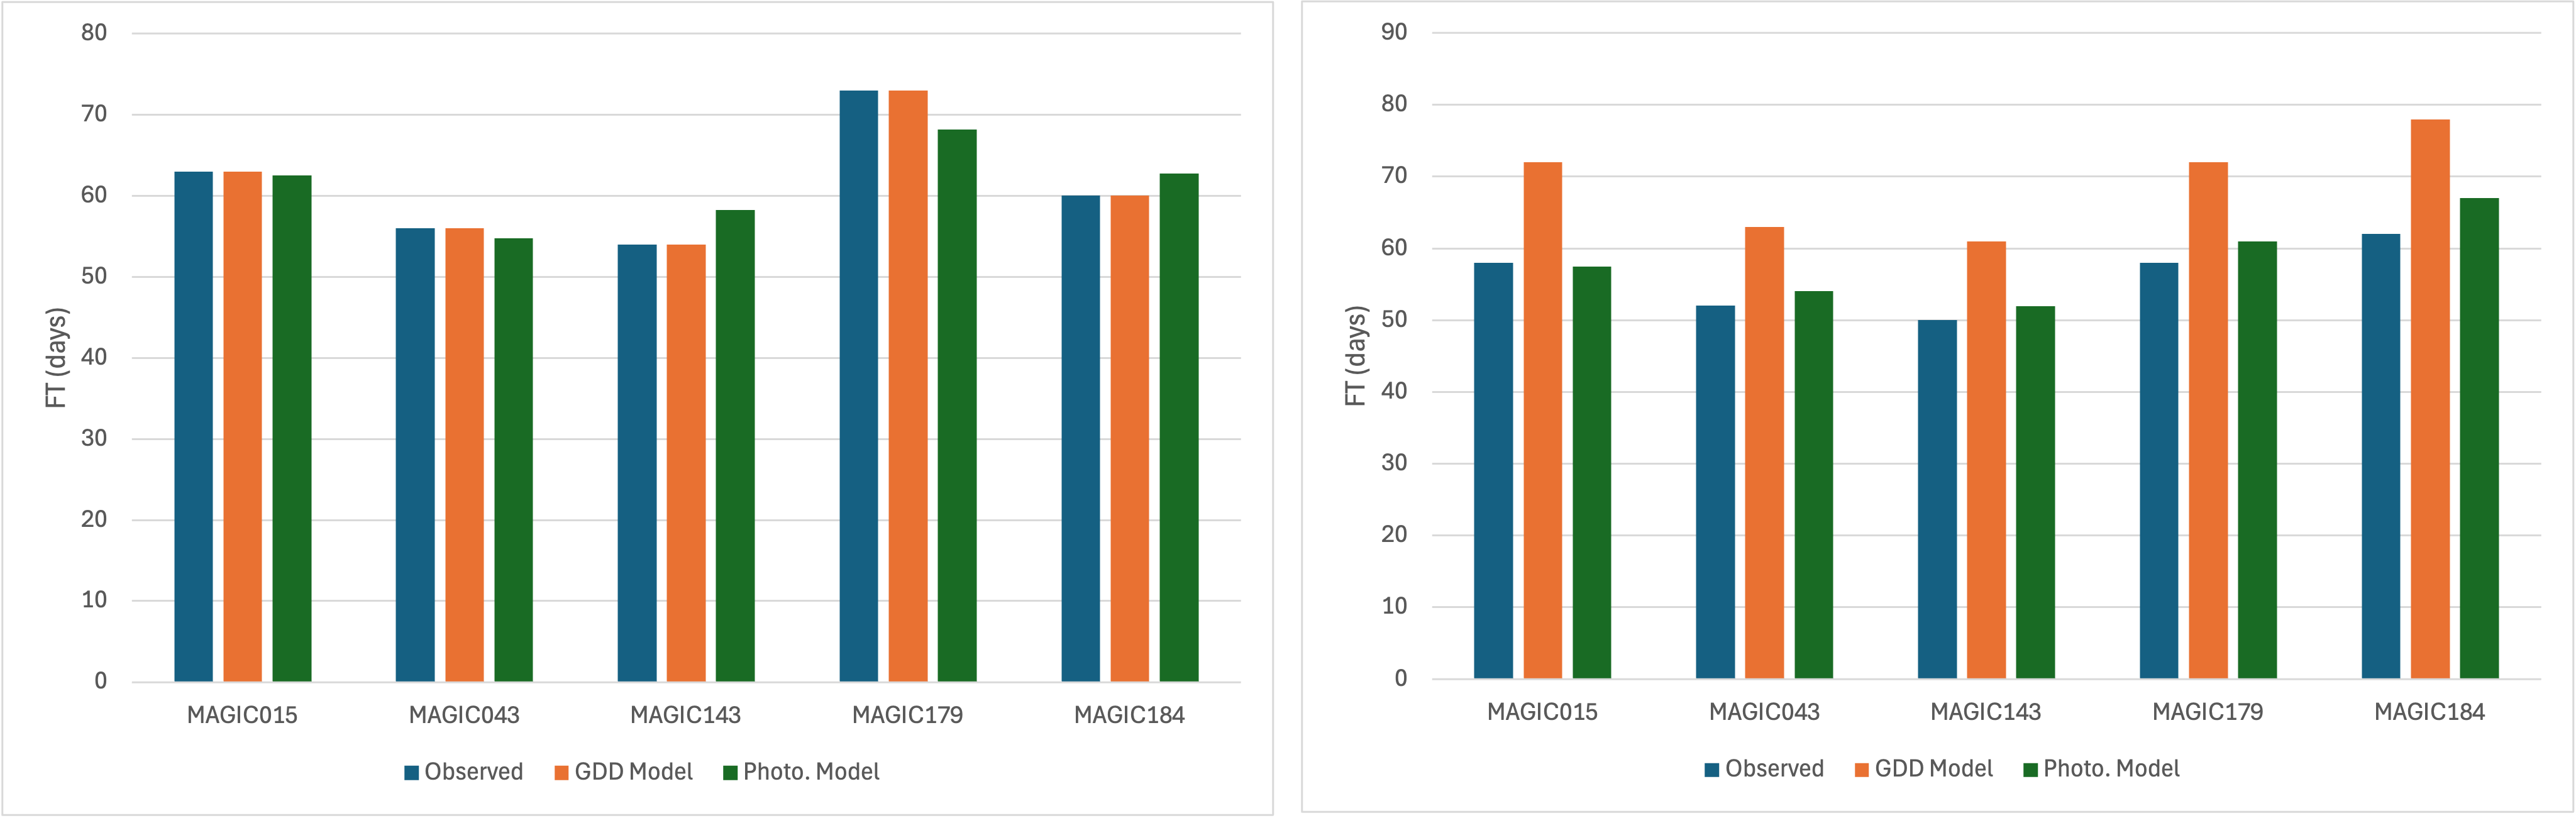 Figure 4: Left — predicted vs. observed flowering time per genotype for Davis. Right — comparison of GDD and Photosynthesis model predictions against observed Kearney values.
| Model | Davis RMSE | Kearney RMSE |
|---|---|---|
| GDD | 0.007 | 13.417 |
| Photosynthesis | 3.183 | 2.899 |
The GDD model collapses under cross-environment transfer (RMSE jumps from 0.007 to 13.417), while the photosynthesis model maintains consistent error (3.183 → 2.899), demonstrating superior generalization across diverse environments.
Environmental Sensitivity
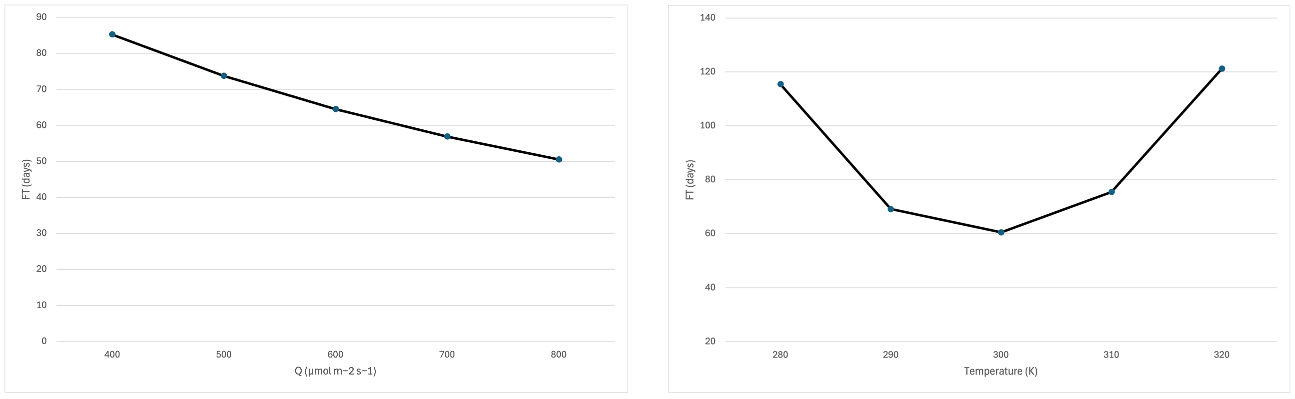 Figure 5: Effect of varying PPFD (left) and atmospheric temperature (right) on average predicted flowering time.
Flowering time decreases as PPFD increases but converges at high light levels, consistent with the hyperbolic J response in the FvCB model. Optimal temperature for earliest flowering is ~300 K when PPFD is fixed at 650 μmol/m²/s.
Conclusion
The cumulative photosynthesis model, while fitting training data less tightly than GDD, generalizes significantly better to new environments. Incorporating FvCB-based photosynthetic rate as a predictor of flowering time captures the mechanistic link between carbon assimilation and plant development, making it more robust for deployment across diverse field conditions.